






“When I turned 2, I was really anxious, because I’d doubled my age in a year. I thought, if this keeps up, by the time I’m 6 I’ll be 90.” – Stephen Wright, Standup Comedian
All of us at CHARGE come up against a wall at least once a week: the inability of people (investors, car buyers, or dopey friends) to understand exponential growth. Stephen Wright got it at the age of two. But for everybody else here is: Exponential Growth – The Basics.
But first an illustration from the classics.
The story goes that a bored eastern ruler commissioned an underling to devise a boredom reliever. He came up with the game of chess. The energized king asked him to name his reward. The underling said he didn’t want money, merely one grain of rice on the first block of the chess board, two grains on the second block, four on the third block, and so forth. The king – thinking linearly instead of exponentially immediately agreed. A day later his finance minister sheepishly informed him that the reward would come to more rice than there was in the entire empire. Can you do the maths, should I draw you a picture, or do you want to watch the YouTube video?

|
Square |
Grains |
1kg of rice = 15000 grains |
|
1 |
1 |
0 |
|
2 |
2 |
0 |
|
3 |
4 |
0 |
|
4 |
8 |
0 |
|
5 |
16 |
0 |
|
6 |
32 |
0 |
|
7 |
64 |
0 |
|
8 |
128 |
0 |
|
9 |
256 |
0 |
|
10 |
512 |
0 |
|
11 |
1 024 |
0 |
|
12 |
2 048 |
0 |
|
13 |
4 096 |
0 |
|
14 |
8 192 |
1 |
|
15 |
16 384 |
1 |
|
16 |
32 768 |
2 |
|
17 |
65 536 |
4 |
|
18 |
131 072 |
9 |
|
19 |
262 144 |
17 |
|
20 |
524 288 |
35 |
|
21 |
1 048 576 |
70 |
|
22 |
2 097 152 |
140 |
|
23 |
4 194 304 |
280 |
|
24 |
8 388 608 |
559 |
|
25 |
16 777 216 |
1 118 |
|
26 |
33 554 432 |
2 237 |
|
27 |
67 108 864 |
4 474 |
|
28 |
134 217 728 |
8 948 |
|
29 |
268 435 456 |
17 896 |
|
30 |
536 870 912 |
35 791 |
|
31 |
1 073 741 824 |
71 583 |
|
32 |
2 147 483 648 |
143 166 |
|
33 |
4 294 967 296 |
286 331 |
|
34 |
8 589 934 592 |
572 662 |
|
35 |
17 179 869 184 |
1 145 325 |
|
36 |
34 359 738 368 |
2 290 649 |
|
37 |
68 719 476 736 |
4 581 298 |
|
38 |
137 438 953 472 |
9 162 597 |
|
39 |
274 877 906 944 |
18 325 194 |
|
40 |
549 755 813 888 |
36 650 388 |
|
41 |
1 099 511 627 776 |
73 300 775 |
|
42 |
2 199 023 255 552 |
146 601 550 |
|
43 |
4 398 046 511 104 |
293 203 101 |
|
44 |
8 796 093 022 208 |
586 406 201 |
|
45 |
17 592 186 044 416 |
1 172 812 403 |
|
46 |
35 184 372 088 832 |
2 345 624 806 |
|
47 |
70 368 744 177 664 |
4 691 249 612 |
|
48 |
140 737 488 355 328 |
9 382 499 224 |
|
49 |
281 474 976 710 656 |
18 764 998 447 |
|
50 |
562 949 953 421 312 |
37 529 996 895 |
|
51 |
1 125 899 906 842 620 |
75 059 993 790 |
|
52 |
2 251 799 813 685 250 |
150 119 987 579 |
|
53 |
4 503 599 627 370 500 |
300 239 975 158 |
|
54 |
9 007 199 254 740 990 |
600 479 950 316 |
|
55 |
18 014 398 509 482 000 |
1 200 959 900 632 |
|
56 |
36 028 797 018 964 000 |
2 401 919 801 264 |
|
57 |
72 057 594 037 927 900 |
4 803 839 602 529 |
|
58 |
144 115 188 075 856 000 |
9 607 679 205 057 |
|
59 |
288 230 376 151 712 000 |
19 215 358 410 114 |
|
60 |
576 460 752 303 423 000 |
38 430 716 820 228 |
|
61 |
1 152 921 504 606 850 000 |
76 861 433 640 457 |
|
62 |
2 305 843 009 213 690 000 |
153 722 867 280 913 |
|
63 |
4 611 686 018 427 390 000 |
307 445 734 561 826 |
|
64 |
9 223 372 036 854 780 000 |
614 891 469 123 652 |
|
Total |
18 446 744 073 709 600 000 |
1 229 782 938 247 300 |
Eighteen zeroes denote a quintillion. Eighteen quintillion is five thousand times China’s total rice production in 2022. I.e., it would take China 5000 years to pay the underling, assuming no one else eats any rice in that time. He understood exponential growth – the ruler didn’t.
To get back to the point.
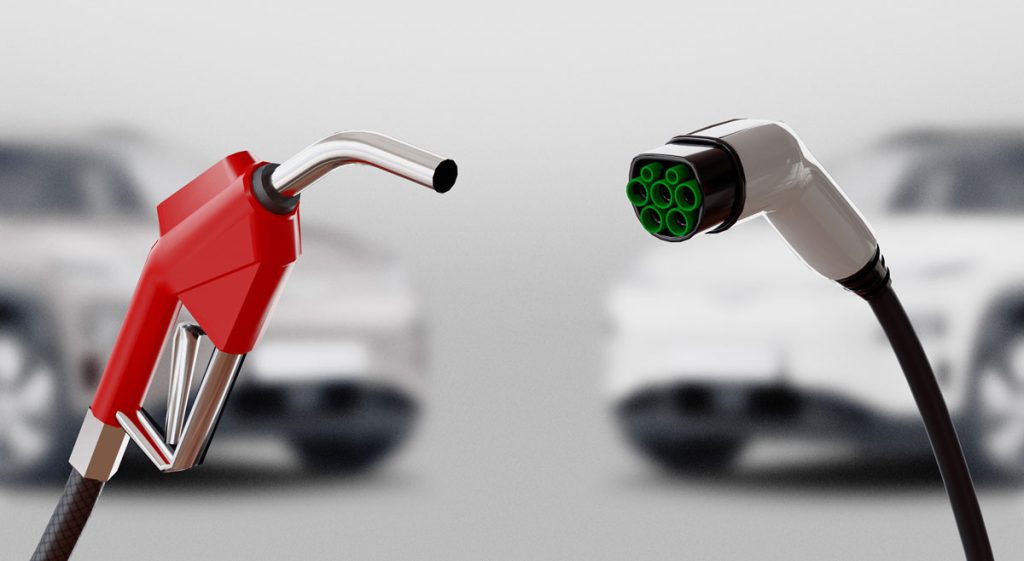
Some people are dismissive of the uptake of EVs, often citing the low sales figures. I have two words for them: exponential growth.
Let’s take those low sales figures and put them on a chessboard.
| Year | EVs sold | % Increase |
| 2018 | 58 | |
| 2019 | 64 | 10% |
| 2020 | 118 | 84% |
| 2021 | 218 | 85% |
| 2022 | 502 | 130% |
| 2023 | 1064 | 112% |
| Year | Projected sales | % Increase |
| 2024 | 2 117 | 99% |
| 2025 | 4 214 | 99% |
| 2026 | 8 385 | 99% |
| 2027 | 16 686 | 99% |
| 2028 | 33 205 | 99% |
| 2029 | 66 078 | 99% |
| 2030 | 131 496 | 99% |
| 2031 | 261 677 | 99% |
| 2032 | 520 738 | 99% |
Since full EV sales became a thing growth has been between 84 and 130% per annum. That’s an average of 107% growth per annum, but I’m going to round it down to 99% and project it to 2032. Which predicts sales of 520 000 units per annum. “But that’s coming off a Base!” “It’s not sustainable!” “This is Africa!”
Okay so let’s rearrange the grains of rice, by halving the growth to a more conservative, more sustainable 49% growth per annum.
| Year | Projected sales sold | %Increase |
| 2024 | 1 585 | 49% |
| 2025 | 2 362 | 49% |
| 2026 | 3 520 | 49% |
| 2027 | 5 244 | 49% |
| 2028 | 7 814 | 49% |
| 2029 | 11 643 | 49% |
| 2030 | 17 348 | 49% |
| 2031 | 25 848 | 49% |
| 2032 | 38 514 | 49% |
Projected at 49% growth per annum gives us sales of 38 514 units in 2032. Making a total of 115 902 EVs on SA roads if you add the previous 10 years’ sales to the 2032 total and assuming there haven’t been too many Saturday night prangs in Boksburg. At plus-minus R500 000 per car that’s a R19 billion-rand car industry. Not bad for an African country.
Those cars need to be charged somewhere. The average SA motorist spends R55k on fuel costs per year. Multiply that by 115 905 EVs and you’re looking at a 6.3-billion-rand industry, another sizable industry. Part of it will come out of the ICE car and petroleum industries, and the rest of it will be to satisfy population growth and longevity.
Exponential growth is a great thing – unless of course it is on the outstanding amount on your credit card – but it takes some thinking ahead or a pencil and an old envelope. EVs are coming. Lots of them. Just do the maths.
Thanks for reading. If you disagree with my figures, please engage with me at [email protected]. I will gladly post a retraction if I am proved wrong. If you like my figures, please forward them to a friend.
Ps. The King beheaded the underling for making him look like a fool. Bummer! It doesn’t always pay to be a smart aleck.
